
TOLERANCE & INSPECTION

Cp, Cpk, Pp and Ppk in CNC Machining: How to Read Them Correctly

Understand capability versus performance, stability, sampling, measurement systems and how to specify a Cpk requirement in a CNC RFQ.

01

Four indices do not say the same thing

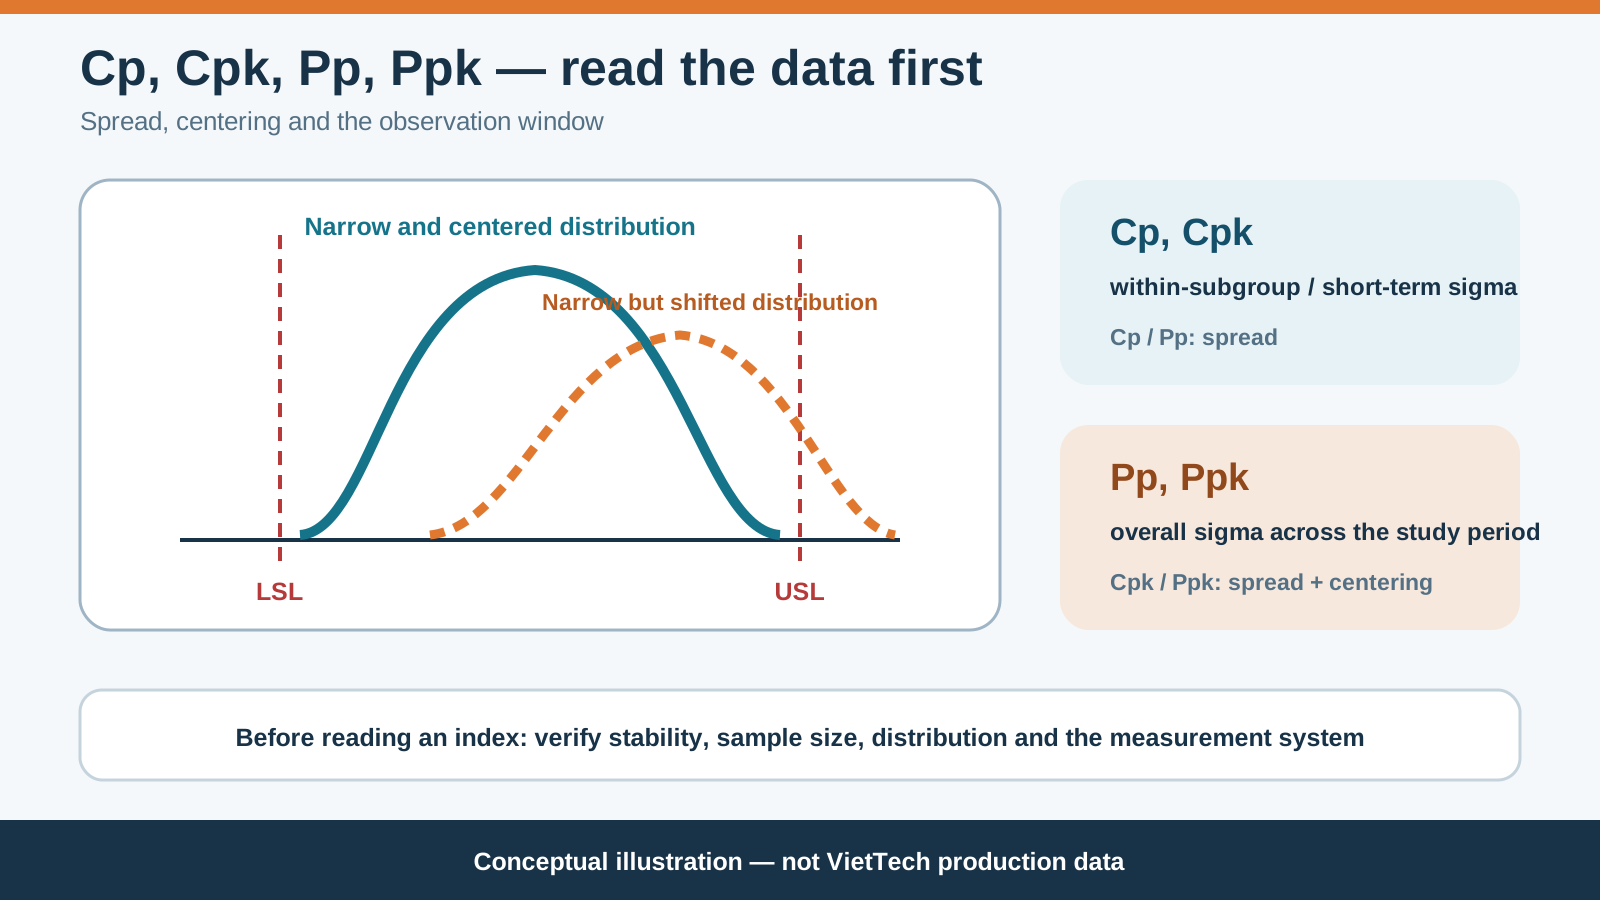
Cp, Cpk, Pp and Ppk all compare observed variation with engineering specification limits, but they are not interchangeable. Cp and Cpk usually use an agreed estimate of within-subgroup or short-term variation. Pp and Ppk use the overall standard deviation across the study period. Cp and Pp compare spread with tolerance width, while Cpk and Ppk also penalize a mean that is close to one specification limit. A high value does not by itself prove process stability, normality, a capable measurement system or that every part passed. Always identify the characteristic, sampling plan, subgroup definition, period and calculation method before interpreting the number.
02

Cp versus Cpk: centering matters

The NIST/SEMATECH Engineering Statistics Handbook presents Cp as tolerance width divided by six estimated standard deviations. It describes potential spread if the process is centered, but does not locate the mean. Cpk uses the smaller distance from the mean to either specification limit relative to three sigma, so it falls when the process is off-center. If Cp is high and Cpk is low, investigate tool wear, offsets, fixture datums, thermal drift and other causes before adjusting the machine. Reacting to every random reading can increase variation.

English diagram explaining Cp Cpk Pp Ppk and process centering
Conceptual illustration: Cp/Pp describe spread, while Cpk/Ppk also respond to centering. The curves are educational and are not VietTech production data.
IndexVariation estimateCentering included?Main question
CpWithin-subgroup/short-termNoIs potential spread narrow enough?
CpkWithin-subgroup/short-termYesHow close is the process to the nearest limit?
PpOverall study-period standard deviationNoHow wide was total observed performance?
PpkOverall standard deviationYesHow did total performance and centering compare with limits?
03

Specification limits are not control limits

USL and LSL come from the drawing or customer requirement. Control limits are calculated from process behavior over time. A small lot can remain inside tolerance while showing special-cause instability; a stable process can still be incapable against a very narrow tolerance. Do not use specification limits as control-chart limits, and do not assume an in-control chart means every part conforms. Capability analysis is normally meaningful only after stability is evaluated. Machine, fixture, program, tool, material, operator, shift and measurement changes should be retained in the data structure instead of pooled blindly.

04

What Pp and Ppk may reveal

Overall standard deviation includes variation across shifts, tool changes, material lots, restarts and environmental changes. Ppk can therefore be lower than Cpk when long-term drift or subgroup differences exist. The gap is a diagnostic signal, not proof that one index is wrong. Short subgroups may hide long-term risk, while a start-up period with deliberate changes may not represent later stable production. The RFQ or control plan should define the study period, subgroup, sampling frequency and reported index. A blanket Cpk requirement for every drawing dimension is rarely efficient; focus on identified critical characteristics.

05

Data and measurement determine credibility

Capability estimates come from samples and have uncertainty. NIST cautions that sample size must be large enough and confidence intervals matter. There is no universal count because risk, subgroup logic, tool cycle and customer rules differ. The measurement system needs suitable resolution, calibration and geometry. Gauge R&R, bias, linearity or measurement uncertainty may need review. Preserve sufficient digits and the time, machine, tool, operator and measurement context. Premature rounding or combining different measurement methods can distort the distribution.

Non-normal data

Skewed, bounded or multimodal data should not be forced through a normal model without an approved method or transformation.

One-sided characteristics

Roughness, runout or burr size may have one functional limit; select and interpret the method accordingly.

06

Practical use in CNC production

Turned diameters, milled sizes, hole positions and ground thicknesses should be subgrouped according to how variation is created. Consecutive parts between tool adjustments may form a rational subgroup, but the actual process must define it. When size drifts with tool life, one pooled index can hide the cycle. Review the time sequence, histogram, special signals, tool changes, offsets and measurement results together. First-off inspection verifies setup and dimensions; a few first parts rarely demonstrate long-term capability. Capability indices also do not replace first article, final inspection, cosmetic checks or material records.

07

How to specify capability in an RFQ

Instead of writing only Cpk ≥ 1.33, identify the characteristic, limits and units; required index; sigma method; subgroup; sample size; frequency; study period; and treatment of special-cause data. State MSA, control chart, raw-data, precision, report and reaction requirements. A threshold such as 1.33 or 1.67 is a contract or quality-policy choice, not a universal law. If a pilot run cannot support a capability claim, an agreed temporary control such as 100% inspection of a critical feature may be appropriate. VietTech reviews measurement time and data requirements during quotation because statistical documentation affects inspection workload.

  • Characteristic, balloon, USL/LSL and unit
  • Cp/Cpk or Pp/Ppk and sigma method
  • Subgroup, frequency and study window
  • Sample size and treatment of start-up/tool change
  • MSA, control chart and raw-data requirements
  • Acceptance threshold and reaction plan
08

Sources and limits

This article is based on the NIST/SEMATECH Engineering Statistics Handbook sections on process capability and graphical assessment against specification limits. Contract work may also invoke ISO 22514, AIAG SPC or sector-specific customer rules; use the licensed edition named by the customer. This article sets no mandatory Cpk threshold, assumes no universal normal distribution and does not replace statistical expertise. VietTech confirms any capability plan only after reviewing the drawing, volume, measurement method, customer rules and demonstrated process behavior.

RELATED PAGES

Gauge R&R for CNC Part Inspection: Repeatability, Reproducibility and Study Design ↗Temperature Effects in Dimensional Inspection: When Should Parts Stabilize? ↗How to Request a Quote ↗

FAQ

Frequently asked questions

What does high Cp but low Cpk mean?

The spread may be potentially narrow enough, but the mean is shifted toward one limit. Investigate the cause before applying offsets.

Can Cpk and Ppk be equal?

They can be close when the process is stable and within-subgroup variation resembles overall variation, but the data structure must be checked.

Is Cpk 1.33 always mandatory?

No. The customer, industry or control plan sets the threshold according to characteristic risk.

Can Cpk be claimed from a few first-off parts?

A number can be calculated, but a small first-off sample is usually not credible evidence of long-term capability.

Does Cpk replace 100% inspection?

Not automatically. Inspection reduction requires an approved control plan and customer authorization.

TOLERANCE & INSPECTION

Need a capability plan for a CNC part?

Send the drawing, critical characteristics, limits, volume, sampling plan, MSA requirement and report format. VietTech will review machining, measurement and data collection before quotation.REQUEST A QUOTE ↗